Overview:
The Totals Report is an administrative tool available exclusively within a School or District Admin Account. Designed to work most effectively alongside Managed Subject Tabs. The Totals Report provides a schoolwide or districtwide performance overview. Users can view aggregated data for the entire district or drill down into results by individual schools or specific teachers.
Step-by-Step Instructions:
1. From your Admin Dashboard, select Data from the left side of the application window. This will take you to the Data Page, which will always default on the Teachers level of the hierarchy if you're in a School Admin Account, or on the Schools level of the hierarchy if you're in a District Admin Account.
Note: The School Reports (or District Reports if in a District Admin Account) button in the bottom right corner of the application (see Image 1) will remain constant throughout all levels of the Data Page hierarchy by default.
2. Click on the blue School or District Reports button in the bottom right corner of the application screen (see Image 1) to see all the available School / District Reports.
Image 1
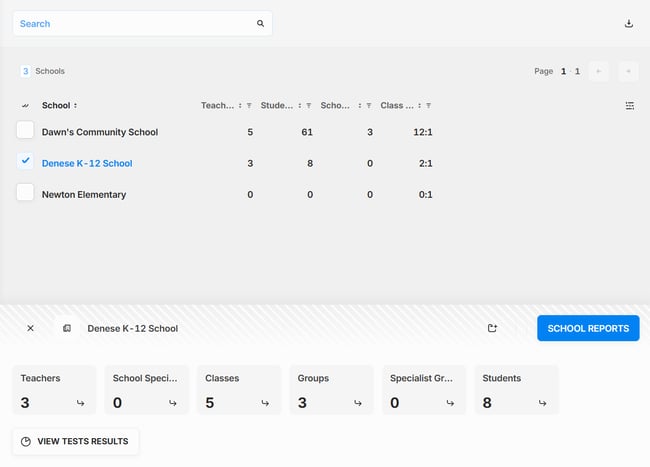
Note: If you are in a District Admin Account and would like to run the School Totals Report, you will first need to click the checkbox to the left of one of the schools from the data page list in order for the School Reports button to appear.
3. Select School or District Totals from the pop-up that appears.
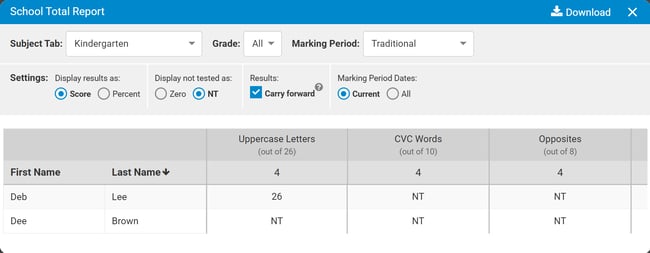
4. Once the report page opens, you can easily switch to run the report for another Subject Tab by clicking the Subject Tab: drop-down arrow. To run the report for a specific grade level, click the Grade drop down arrow and select the grade level. Lastly, you can select the Marking Period by using the Marking Period: dropdown (see Image 2).
5. Configure your report settings (see Image 2):
- "Display results as":
- If the Score radio button is selected, the student score for the test will be shown.
- If the Percent radio button is selected, the percentage will be shown.
- "Display not tested as":
- If the NT radio button is selected, an "NT" will display if the student was not tested.
- If the Zero radio button is selected, those same values become 0.
- "Results":
- If Carry forward is checked, the score will reflect the student's last test session regardless which marking period they were tested in. If the student is not tested during the 2nd marking period, the 1st marking period's score will remain.
- If Carry forward" is not checked, only the scores from specific marking periods are shown.
- "Marking Period Dates":
- If the Current radio button is selected, only scores from the current marking period will be shown.
- If the All radio button is selected, scores from all marking periods will be shown.
6. Sort the report by clicking on Last Name, Marking Period for a Test, or the Average % Correct (see Image 2). The arrow next to the column heading identifies the sorted column.
7. When you have completed reading your report results, You can Download the report via a PDF, Google PDF, Google Sheets file or Excel Worksheet.
Image 2
Interpreting Your Totals Report
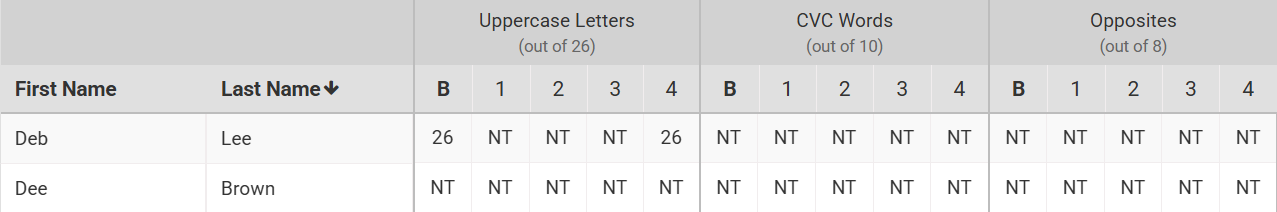
At the start of the school year, the School or District Totals report displays two columns for each test. The “B” column shows the Baseline score, and the “1” column shows the score for the First Marking Period (see Image 3).
The Baseline Score - This is the number of questions the student answered correctly the first time the test was administered, regardless of test date or marking period. If the student was in ESGI last year (either as a full student or for a pre-assessment), the “B” score represents the final score from the previous year, but only when the exact same test is used across both years. The “B” score can be changed only by deleting the Baseline Test.
The 1st marking period - The score from the most recent test administration within the 1st marking period. This score will continue to change as the test is re-administered.
The 2nd, 3rd and 4th Marking Periods - As each Marking Period begins the scores will start to display in each column.
Image 3
Scoring Scenarios: Comparing Baseline Scores to Other Marking Period Scores
When running the School or District Totals report, you may notice scoring situations where data does not appear as expected. Below are common scenarios to review if your report results seem inconsistent.
If the "B" score is 0, but the "1st period" column has a number:
- The first time the test was administered, all questions were marked incorrect and the test was closed, which can occur even if only one question was actually missed.
- When the student was assessed again during the 1st marking period, at least one question was answered correctly.
If the "B" score is the same as the "1st period" column, then:
- The test was given only once.
- The test was given more than once, but the student did not get any additional answers correct.
If the "B" score is less than the "1st marking period" column, then:
- The test was given more than once, and the student answered more questions correctly on the 2nd (or 3rd, etc.) time the test was given within the 1st marking period.
If the "B" score is more than the "1st marking period" column, then either:
- The test was given a second time within the 1st marking period, Retest All was selected, and the student did not answer as many correctly as the first time.
- The test was given in the 2nd marking period. The 1st marking period will be "0" and the "2nd period" column will display the score from the most recent test administration in the 2nd marking period.