Overview
The Pie Charts provide a quick glance of the average percent correct/incorrect on a specific test for a group of students or an individual student. They can be viewed directly from the Dashboard or run as a report. District and School Admins have the ability to run the report by grade level.
Notes for District Admins
1. From your Admin Dashboard, select “Data” located on the left side of the application window. This will take you to the Data Page, which will always default on the “Schools” tab.
Please note: The “District Reports” button in the bottom right corner of the application window will remain constant throughout all levels of the Data Page hierarchy by default.
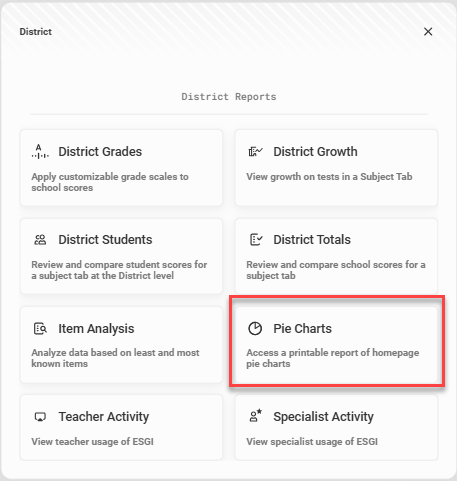
2. Click on the blue “District Reports” in the bottom right corner of the application screen to see all the available reports associated with your selection
3. From this pop-up, click on Pie Charts (see Image 1).
Image 1
4. Click on the School dropdown to select a school as shown in image 2.
5. Click on the Subject Tab dropdown to select a different subject.
6. Click on the Grade dropdown to select a grade level.
7. In the Settings option, check the box to show results for each student. Check the box to print the report in color.
Image 2

Viewing and Printing Pie Charts for a group of students
1. To download to a PDF, click “Download” in the upper right corner, and select “One PDF File” (a single file that contains all students) or “ZIP” (a zipped folder that contains individual files for each student).
2. When downloading a large amount of data, a pop up will appear letting you know the file is generating and will continue to run in the background. Click "Got It" to continue using your account.
3. When the zip files finish downloading, you will get a notification in the lower left corner of your screen. Click on the notification to view and print the file.