Overview
The Pie Charts provide a quick glance of the average percent correct/incorrect on a specific test for a group of students or an individual student. They can be viewed directly from the Dashboard or run as a report. District and School Admins have the ability to run the report by grade level.
1. From your teacher dashboard, open the Reports panel on the left and select Pie Charts.
2. Select the Class, Student, and Subject Tab, along with any tests which you want featured on the report. You also have the option to show individual pie charts for all students
Viewing and Printing Pie Charts for a Group of Students
1. You can run the report for an entire class or for an individual student by choosing the appropriate option from the drop-down menu. Each drop-down allows you to select a different class, student, and Subject Tab. The report can be printed in color or in black and white. (see Image 1)
Image 1

2. To download the report as a PDF, click *Download* in the lower-right corner and choose either *One PDF File* (a single file containing all students) or *ZIP* (a compressed folder with individual files for each student). If you would like to save the PDF or ZIP file directly to your Google Drive, select **Google PDF** or **Google ZIP File** as your download option.
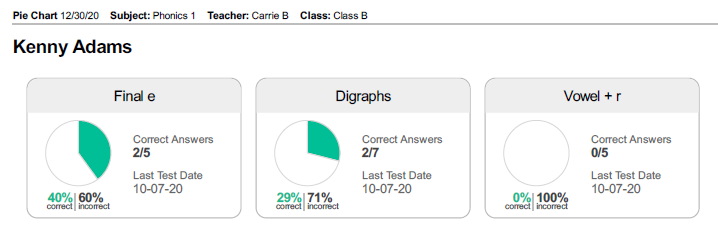
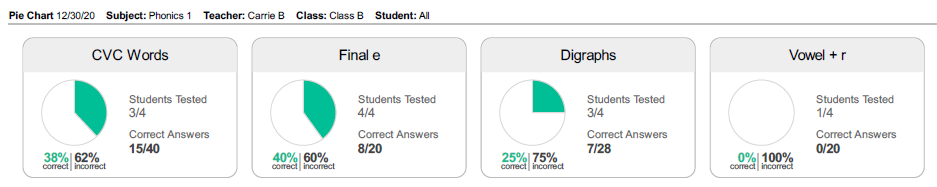
Sample Pie Chart PDF download for a group of students:
An example of the Pie Chart PDF download for an individual student: