Overview
The District Totals report is an administrative tool available exclusively within a District Admin Account. Designed to work most effectively alongside District Managed Subject Tabs, this report providesdistrictwide performance. Users can view aggregated data for the entire district or drill down into results by individual schools or specific teachers.
How to run a District Totals Report
-
From your Admin Dashboard, select “Data” located on the left side of the application window.
-
Select the blue "District Reports" button on the bottom right corner. The “District Reports” button in the bottom right corner of the application window will remain constant throughout all levels of the Data Page hierarchy by default.
-
On the report screen, select "District Totals".
District Totals Report Setting Options
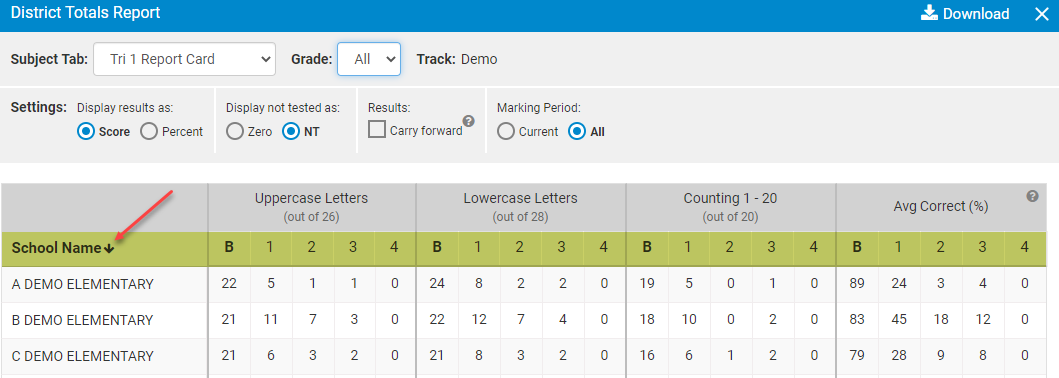
Before reviewing the report results, make sure your settings are configured to display the correct student data. Below is a list of options you can select and how they affect your test data results (Image 1).
-
Subject Tabs: Open this dropdown to view all subject tabs that have been set up for your district. Use this list to choose which subject’s data you want to display in the District Totals report.
-
Grade Level: Open this dropdown to view the different grade levels that have been configured for your district, then select the specific grade level whose data you want to include in the District Totals report.
-
Marking Period: If multiple Marking Period or Track names (e.g., Traditional, Summer School) have been added to your district, use this dropdown to view and select a different option as needed.
-
Display results as:
-
Score - The raw student score for each test will be shown.
-
Percent - The percentage score for each test will be displayed.
-
-
Display not tested as:
-
NT - An "NT" will display if the student was not tested.
-
Zero - A "0" will display if the student was not tested.
-
-
Results:
- Carry forward - The score reflects the student’s most recent test session, regardless of the marking period in which it occurred. If the student is not tested during the 2nd marking period, the score from the 1st marking period will remain. Note: If Carry forward is not checked, only the scores from specific marking periods are shown.
-
Marking Period Dates: The dates are based on your current District/School Track. If your dates need to be updated or changed please use this Support Article on how to change your Marking Periods.
-
Current - Scores from the current marking period will be displayed.
-
All - Scores from all marking periods will be displayed.
-
(Image 1)

Interpreting Your District Totals Report
At the start of the school year, the District Totals report displays two columns for each test. The “B” column shows the Baseline score, and the “1” column shows the score for the First Marking Period (Image 2).
 (Image 2)
The Baseline Score - This is the number of questions the student answered correctly the first time the test was administered, regardless of test date or marking period. If the student was in ESGI last year (either as a full student or for a pre-assessment), the “B” score represents the final score from the previous year, but only when the exact same test is used across both years. The “B” score can be changed only by deleting the Baseline Test.
The 1st marking period - The score from the most recent test administration within the 1st marking period. This score will continue to change as the test is re-administered.
The 2nd, 3rd and 4th Marking Periods - As each Marking Period begins the scores will start to display in each column.
Scoring Scenarios: Comparing Baseline Scores to Other Marking Period Scores
When running the District Totals report, you may notice scoring situations where data does not appear as expected. Below are common scenarios to review if your report results seem inconsistent.
If the "B" score is 0, but the "1st period" column has a number:
-
The first time the test was administered, all questions were marked incorrect and the test was closed, which can occur even if only one question was actually missed.
-
When the student was assessed again during the 1st marking period, at least one question was answered correctly.
If the "B" score is the same as the "1st period" column, then:
- The test was given only once.
- The test was given more than once, but the student did not get any additional answers correct.
If the "B" score is less than the "1st marking period" column, then:
- The test was given more than once, and the student answered more questions correctly on the 2nd (or 3rd, etc.) time the test was given within the 1st marking period.
If the "B" score is more than the "1st marking period" column, then either:
- The test was given a second time within the 1st marking period, Retest All was selected, and the student did not answer as many correctly as the first time.
- The test was given in the 2nd marking period. The 1st marking period will be "0" and the "2nd period" column will display the score from the most recent test administration in the 2nd marking period.
Sorting the Report
Sort the report by selecting School Name, Marking Period for a test, or Average % Correct. An arrow next to the column header shows which column is currently sorted (Image3).
(Image 3)
Downloading the Report via PDF or Excel
When you have completed reading your report results, You can Download the report via a PDF, Google PDF, Google Sheets file or Excel Worksheet.